Metrics
Metrics
The following 12 metrics are used for characterizing the performance of an object detector on COCO:
Compute average precision (AP) from prediction scores
AP summarizes a precision-recall curve as the weighted mean of precisions achieved at each threshold, with the increase in recall from the previous threshold used as the weight:
where Pn and Rn are the precision and recall at the nth threshold. This implementation is not interpolated and is different from computing the area under the precision-recall curve with the trapezoidal rule, which uses linear interpolation and can be too optimistic.
Note: this implementation is restricted to the binary classification task or multilabel classification task.
AP: AP at IoU=.50:.05:.95 (primary challenge metric)
APIoU=.50: AP at IoU=.50 (PASCAL VOC metric)
APIoU=.75: AP at IoU=.75 (strict metric)
Interpolated AP
PASCAL VOC is a popular dataset for object detection. For the PASCAL VOC challenge, a prediction is positive if IoU ≥ 0.5. Also, if multiple detections of the same object are detected, it counts the first one as a positive while the rest as negatives.
In Pascal VOC2008, an average for the 11-point interpolated AP is calculated.

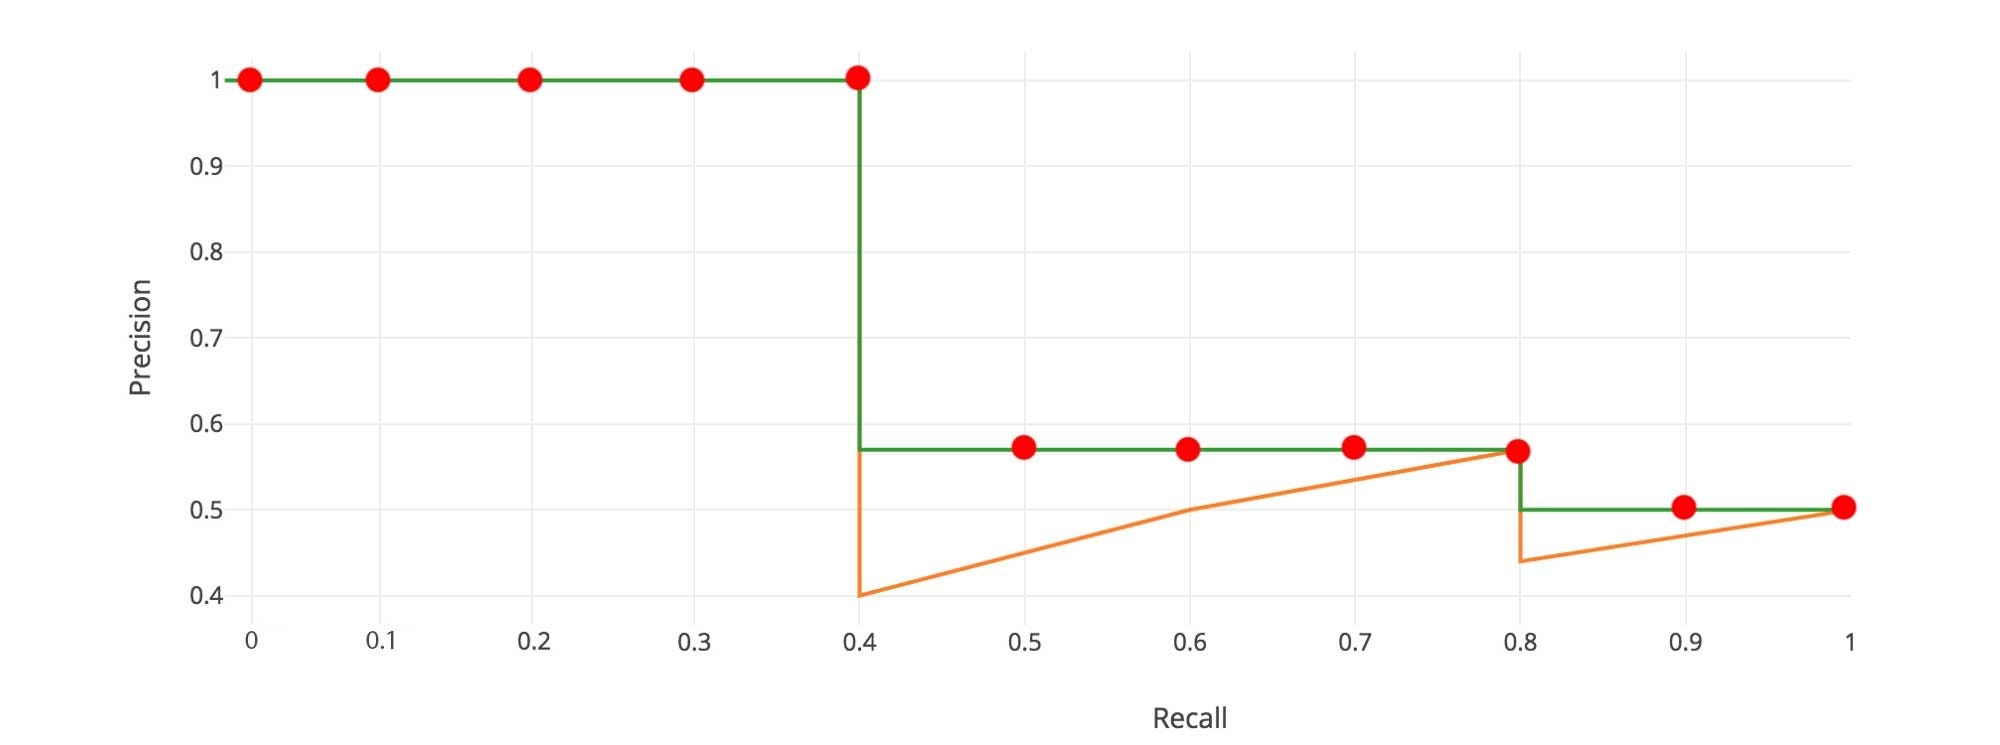
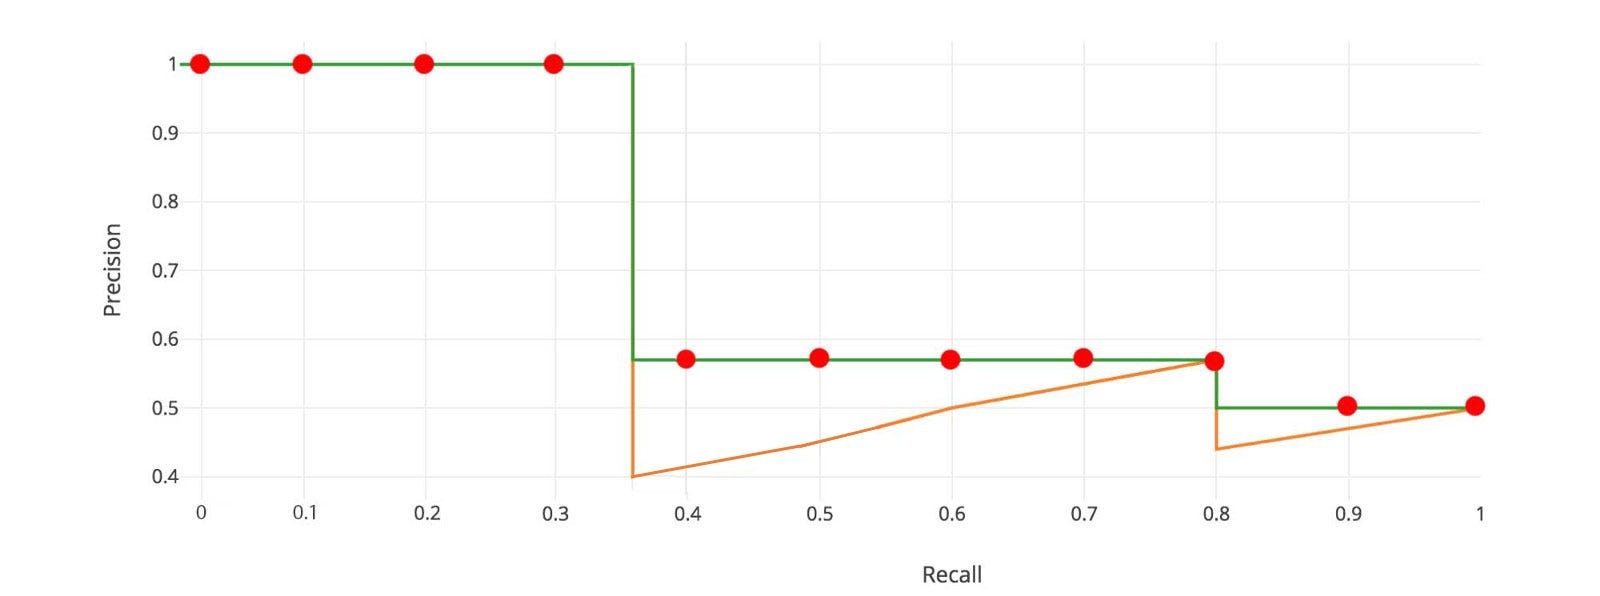
First, we divide the recall value from 0 to 1.0 into 11 points — 0, 0.1, 0.2, …, 0.9 and 1.0. Next, we compute the average of maximum precision value for these 11 recall values.

In our example, AP = (5 × 1.0 + 4 × 0.57 + 2 × 0.5)/11
Here are the more precise mathematical definitions.

When _AP_ᵣ turns extremely small, we can assume the remaining terms to be zero. i.e. we don’t necessarily make predictions until the recall reaches 100%. If the possible maximum precision levels drop to a negligible level, we can stop. For 20 different classes in PASCAL VOC, we compute an AP for every class and also provide an average for those 20 AP results.
According to the original researcher, the intention of using 11 interpolated point in calculating AP is
The intention in interpolating the precision/recall curve in this way is to reduce the impact of the “wiggles” in the precision/recall curve, caused by small variations in the ranking of examples.
However, this interpolated method is an approximation which suffers two issues. It is less precise. Second, it lost the capability in measuring the difference for methods with low AP. Therefore, a different AP calculation is adopted after 2008 for PASCAL VOC.
AP (Area under curve AUC)
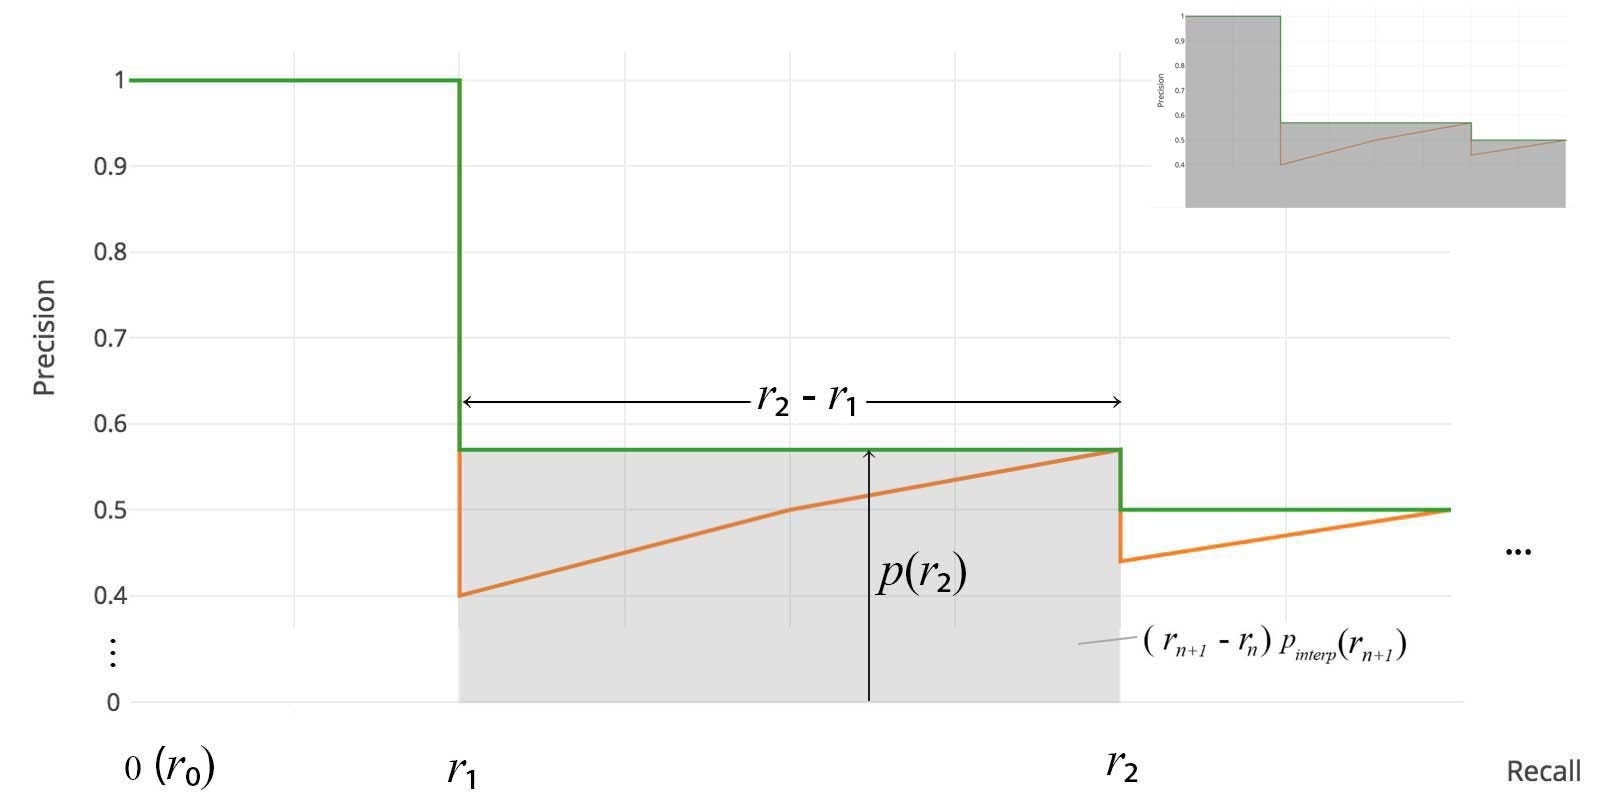
For later Pascal VOC competitions, VOC2010–2012 samples the curve at all unique recall values (r₁, r₂, …), whenever the maximum precision value drops. With this change, we are measuring the exact area under the precision-recall curve after the zigzags are removed.

No approximation or interpolation is needed. Instead of sampling 11 points, we sample p(rᵢ) whenever it drops and computes AP as the sum of the rectangular blocks.

This definition is called the Area Under Curve (AUC). As shown below, as the interpolated points do not cover where the precision drops, both methods will diverge.

AP Across Scales:
APsmall: AP for small objects: area<322
APmedium: AP for medium objects: 322<area<962
APlarge: AP for large objects: area>962
Average Recall (AR):
ARmax=1: AR given 1 detection per image
ARmax=10: AR given 10 detections per image
ARmax=100: AR given 100 detections per image
AR Across Scales:
ARsmall: AR for small objects: area<322
ARmedium: AR for medium objects: 322<area<962
ARlarge: AR for large objects: area>962
Description
1.Unless otherwise specified, AP and AR are averaged over multiple Intersection over Union (IoU) values. Specifically we use 10 IoU thresholds of .50:.05:.95. This is a break from tradition, where AP is computed at a single IoU of .50 (which corresponds to our metric APIoU=.50). Averaging over IoUs rewards detectors with better localization.
2.AP is averaged over all categories. Traditionally, this is called "mean average precision" (mAP). We make no distinction between AP and mAP (and likewise AR and mAR) and assume the difference is clear from context.
3.AP (averaged across all 10 IoU thresholds and all 80 categories) will determine the challenge winner. This should be considered the single most important metric when considering performance on COCO.
4.In COCO, there are more small objects than large objects. Specifically: approximately 41% of objects are small (area<322), 34% are medium (322<area<962), and 24% are large (area>962). Area is measured as the number of pixels in the segmentation mask.
5.AR is the maximum recall given a fixed number of detections per image, averaged over categories and IoUs. AR is related to the metric of the same name used in proposal evaluation but is computed on a per-category basis.
6.All metrics are computed allowing for at most 100 top-scoring detections per image (across all categories). The evaluation metrics for detection with bounding boxes and segmentation masks are identical in all respects except for the IoU computation (which is performed over boxes or masks, respectively).
mAP
mAP (mean average precision) is the average of AP. In some context, we compute the AP for each class and average them. But in some context, they mean the same thing. For example, under the COCO context, there is no difference between AP and mAP. Here is the direct quote from COCO:
AP is averaged over all categories. Traditionally, this is called “mean average precision” (mAP). We make no distinction between AP and mAP (and likewise AR and mAR) and assume the difference is clear from context.
In ImageNet, the AUC method is used. So even all of them follow the same principle in measurement AP, the exact calculation may vary according to the datasets. Fortunately, development kits are available in calculating this metric.
Reference
Last updated